On the Project Management page, under All Projects, hover over the project card and click View.
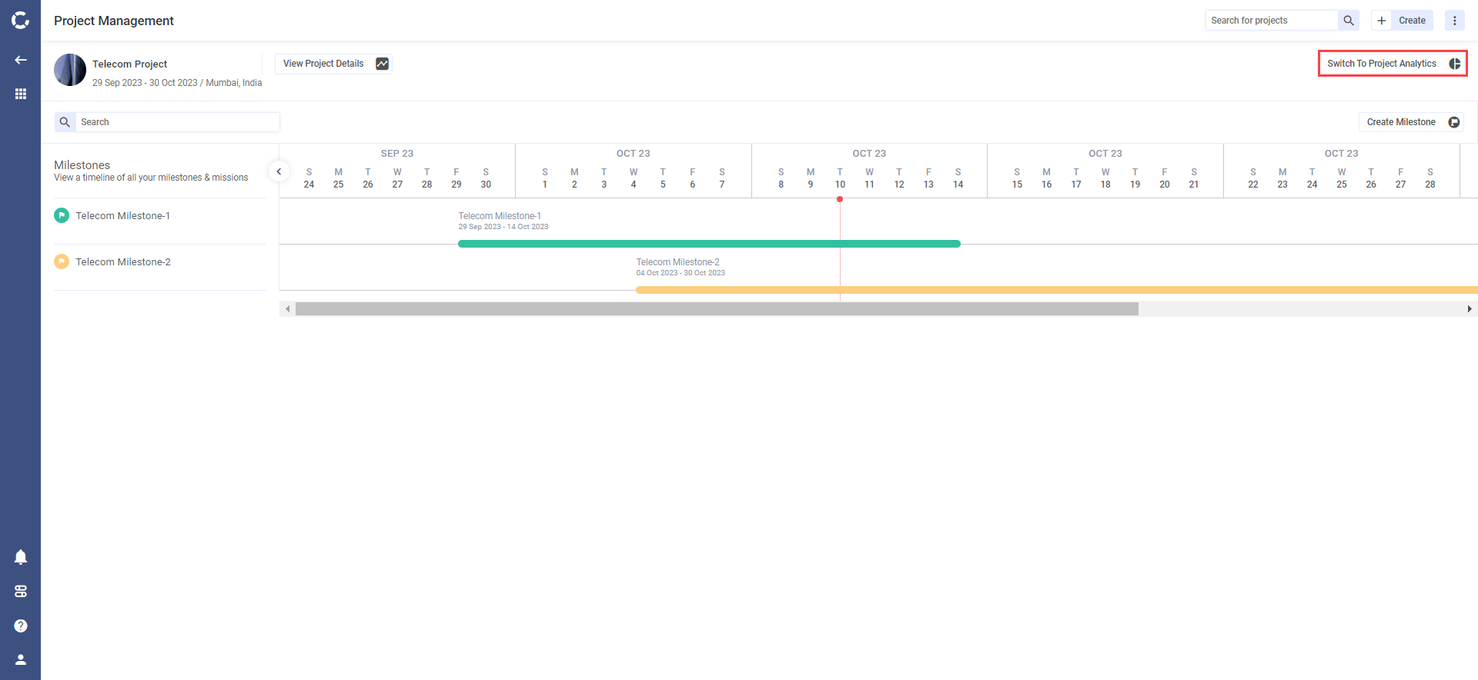
On the project page, click Switch to Project Analytics.

Switch to Project Analytics
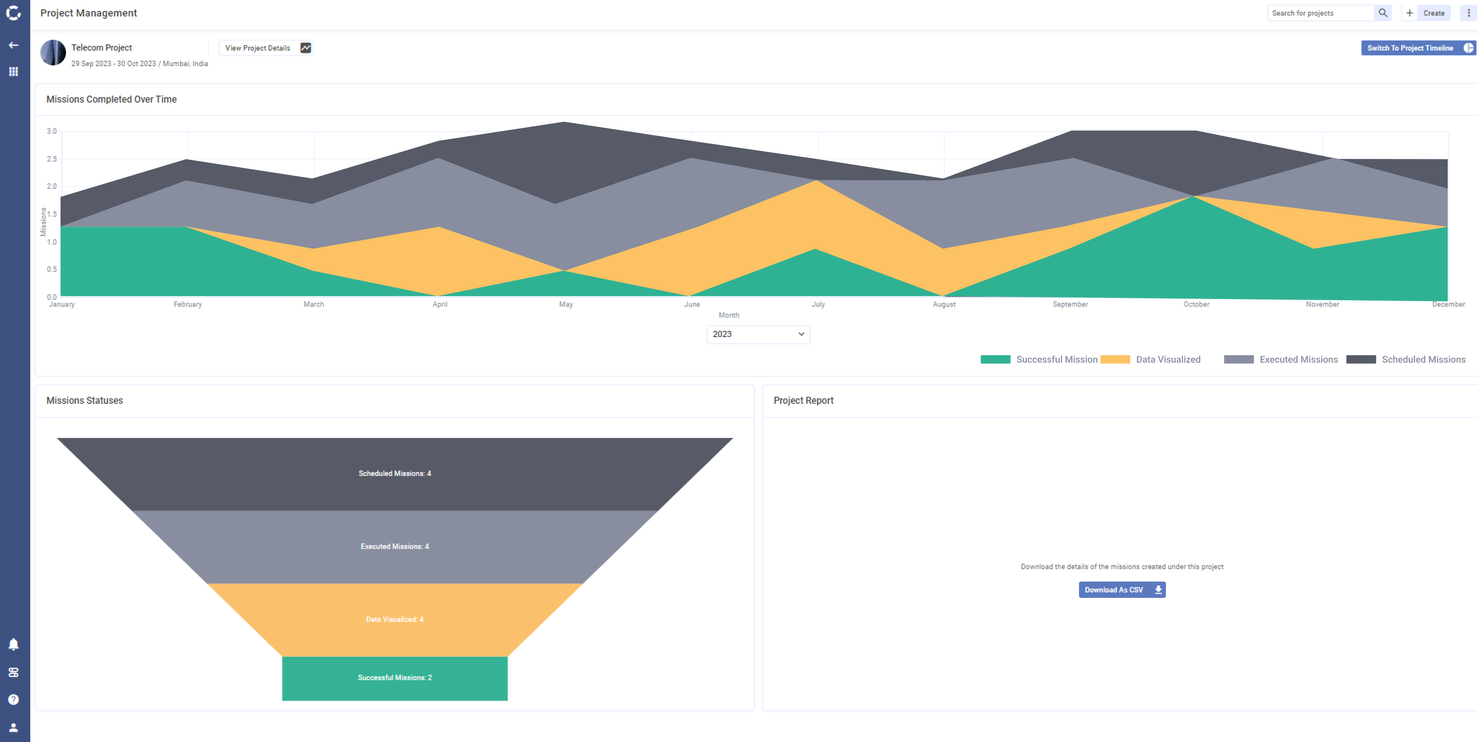
The Project Analytics page is displayed.

Project Analytics
This page shows the following widgets:
Missions Completed Over Time
.png)
Missions Completed Over Time
This widget displays the count of missions completed over a defined period of time with different colors representing scheduled missions, executed missions, successful missions and missions with data visualization. You can show or hide a particular mission status on the graph by selecting the corresponding color bar in the legend.
Mission Statuses

Mission Statuses
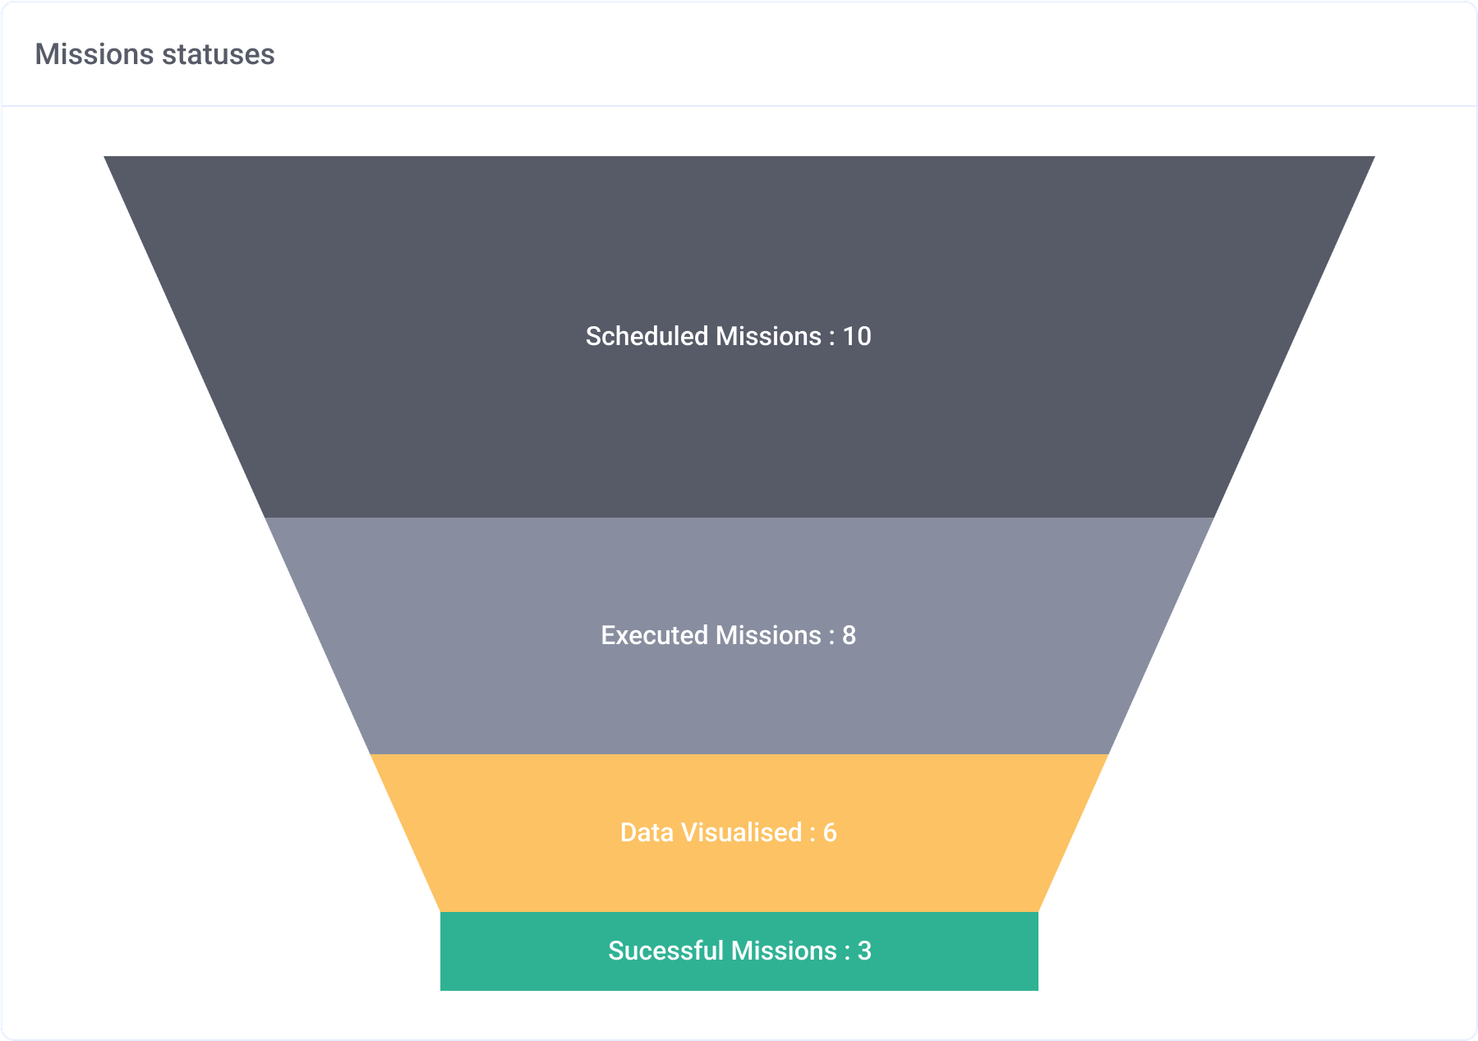
This widget displays the statuses of all missions created under this project in the form of a funnel chart.
The missions are color coded with dark grey representing Scheduled Missions, grey representing Executed Missions, yellow representing missions where Data is Visualized and green representing Successful Missions.
Project Report

Download Project Report
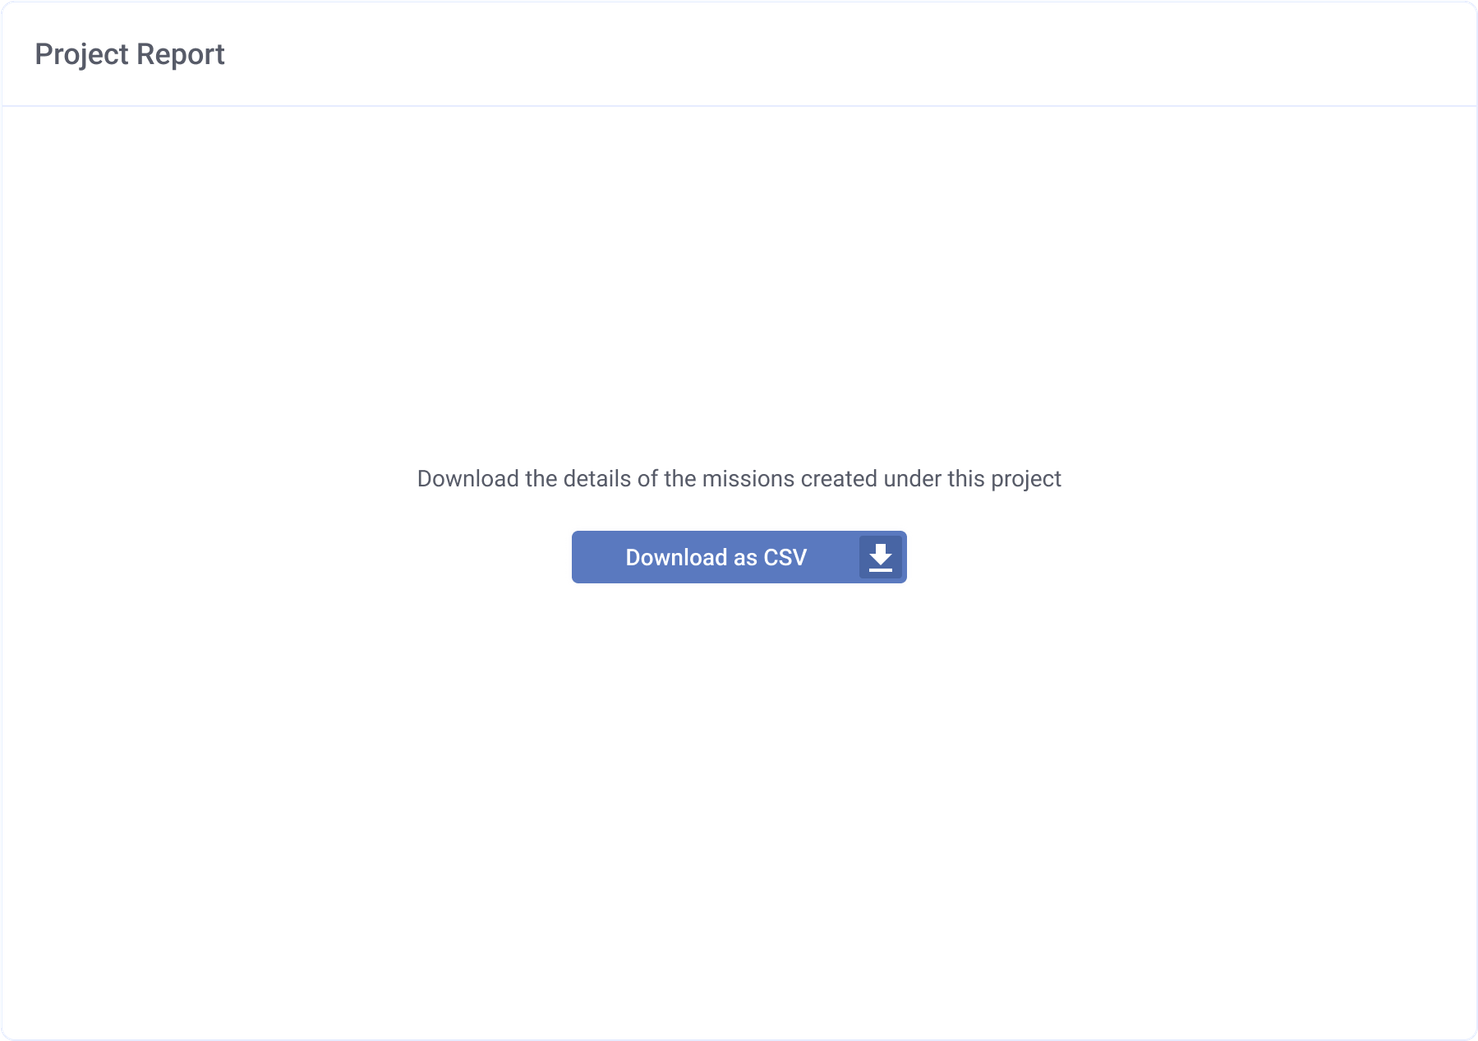
This widget allows you to download the details of the missions created under this project in CSV format.
